China’s rapid electric vehicle adoption is reshaping how homes, businesses, and transport hubs use energy. Solar power can reduce charging costs, improve energy resilience, and lower dependence on grid electricity. However, successful integration requires more than installing panels beside a charger. It requires careful planning.
This guide examines China’s top 10 approaches to how to integrate solar power with EV charging. It considers rooftop systems, solar carports, battery storage, smart chargers, and commercial fleet applications. Each option involves different space, power, and investment requirements. For example, a 60-kilowatt rooftop array may produce strong midday output, while many vehicles arrive after sunset. A battery or controlled charging schedule may therefore become essential.
Good engineering decisions begin with measured data. Designers should review local sunlight, building load profiles, charger capacity, cable routing, and grid connection limits. Qualified installers should also verify equipment compatibility, electrical protection, monitoring functions, and applicable Chinese technical requirements. These details protect performance and user safety. They also make projected savings easier to evaluate.
Real projects rarely perform exactly as spreadsheets predict. Dust, shading, winter weather, battery losses, and changing driving patterns can reduce results. That matters. A system that looks efficient on paper may need stronger load management in daily use. This article presents practical examples and expert considerations, while acknowledging those limitations. The goal is not to promote one universal solution, but to explain how solar generation and EV charging can work together reliably.
China’s 2024 market figures show 12.87 million new energy vehicles sold and 12.82 million charging points installed. These numbers look nearly equal, but they do not mean every vehicle has a dedicated charger. Charging points differ by location, speed, ownership, and daily availability. Public stations may serve taxis and delivery fleets, while private chargers support overnight charging at homes and workplaces.
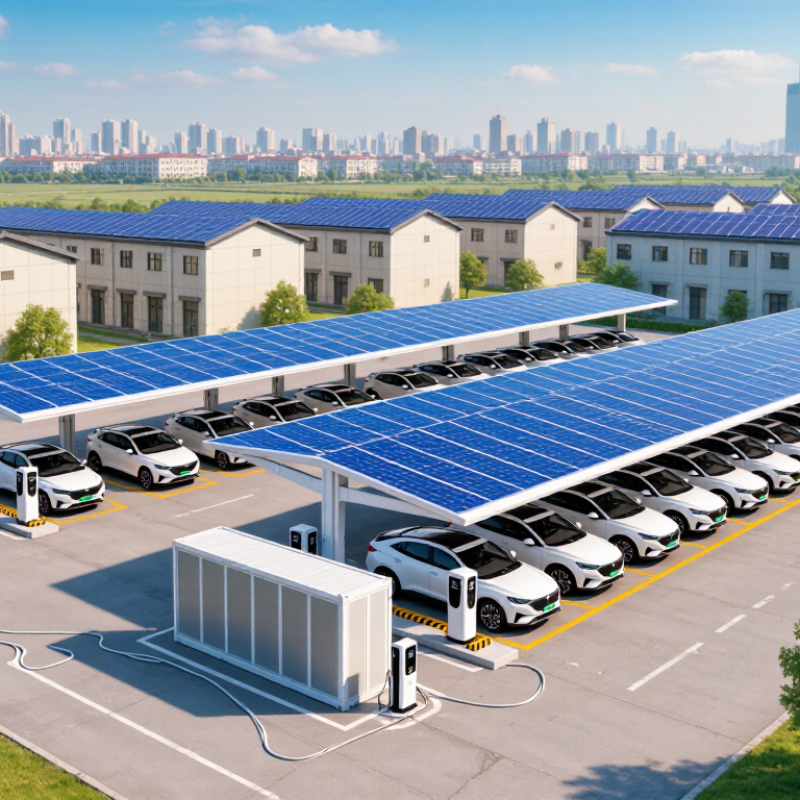
Solar integration should begin with a local demand assessment. A depot with vehicles arriving between 6 p.m. and 9 p.m. needs a different system from a shopping area with daytime traffic. Solar canopies generate power during daylight, when many commercial chargers operate. Battery storage can hold excess electricity for evening charging and reduce short periods of grid stress. Smart controls should limit charging when the site reaches its agreed power capacity.
Small details matter. Panel shade, roof strength, cable length, drainage, and winter sunlight can change the design. A practical survey should record hourly charging demand for several weeks, not rely only on annual averages. Forecasts can be wrong. Cloudy weather, unexpected fleet growth, or low charger use may weaken the original business case. Engineers should therefore compare measured load data with solar output, storage performance, and local grid requirements before construction. The 12.87-million vehicle figure signals strong demand, while the 12.82-million charger figure shows intense infrastructure pressure, not perfect coverage.
China’s solar capacity reached about 887 GW by the end of 2024, according to the National Energy Administration. This national figure changes the design conversation. A charging site should not copy a large utility project. It should measure local sunlight, vehicle arrivals, transformer limits, and evening demand. A useful starting point is a PV-storage system sized around daytime charging, not maximum panel output. For example, a workplace with steady midday parking may need less battery capacity than a highway site with sharp evening peaks. Small differences matter.
Battery storage can absorb surplus solar at noon and release energy when drivers return. However, oversizing storage adds cost, weight, and future replacement pressure. That part is often underestimated.
Engineers should compare hourly load data with seasonal PV output, then test cloudy weeks and winter conditions. A practical design also needs safe electrical protection, clear maintenance access, and metering that separates solar generation from grid power. Field experience shows that simple controls are easier to inspect and repair.
Tips:
Record charging demand in 15-minute intervals for several months. Check transformer capacity before selecting chargers. Leave space for later expansion. Do not assume every parked vehicle will charge. Review battery performance after hot summers and cold periods. NEA statistics provide national context, but reliable sizing still depends on the individual site. Many early plans are too optimistic. Reflection is necessary.
Solar-powered EV charging in China needs more than photovoltaic panels and a large battery. A grid-tied DC hub should be designed around China’s GB/T 20234 charging interface requirements. The connector, control contacts, locking structure, and safety sequence must match the vehicle inlet. GB/T 20234.3 is especially relevant to DC charging equipment. Communication and charging control also require careful coordination with related national standards.
The hub can combine solar inverters, stationary batteries, DC chargers, and a grid connection behind one coordinated energy system. During midday, solar power may serve vehicles directly. Extra energy can charge the battery. At night, the grid can support charging without overloading the local transformer. Protection devices should cover overcurrent, leakage, surge events, insulation faults, and emergency shutdowns. Accurate metering is essential for energy management and transparent billing.
Field experience shows that cable temperature, dust, rainwater, and uneven parking habits can affect performance. A clean simulation is not enough. Installers should test connector heating, communication recovery, and load changes under real site conditions. The design should also leave space for maintenance. A perfect solar forecast is impossible. Poor weather may expose an undersized battery or an overly optimistic grid plan. Engineers should review these weak points before construction, not after the first busy holiday.
China's new energy vehicle fleet and public charging infrastructure have expanded rapidly. This growth supports grid-tied DC hub designs that combine photovoltaic generation, battery storage, and GB/T 20234-compatible charging interfaces to reduce grid peaks and increase renewable-energy utilization.
Data: year-end public charging facilities from the China Electric Vehicle Charging Infrastructure Promotion Alliance; new energy vehicle ownership from China's Ministry of Public Security.
China Top 10 How to Integrate Solar Power with EV Charging?
China’s 31.4 million NEVs need more than additional charging sockets. The Ministry of Public Security reported 31.4 million registered NEVs by the end of 2024. During the same period, the National Energy Administration recorded about 12.8 million charging facilities nationwide. This scale makes coordinated energy management essential.
Solar can charge vehicles during midday, when photovoltaic output is high. Smart chargers should adjust power according to solar production, grid prices, battery needs, and local transformer capacity. The IEA’s Global EV Outlook 2024 highlights China’s leading role in electric mobility and charging infrastructure. However, solar output changes quickly. Forecasts still miss clouds. Operators need storage, backup capacity, and clear charging priorities.
V2G can turn parked vehicles into flexible grid resources. A fleet connected at workplaces or residential hubs could discharge during evening peaks, then recharge overnight. Field projects should measure battery degradation, user acceptance, and payment accuracy. The technology is promising, but a perfect algorithm is unrealistic.
Tips: Start with solar-rich depots and predictable parking times. Install smart meters before adding V2G controls. Use conservative discharge limits, transparent compensation, and cybersecurity testing. Review results monthly, because real driving patterns often differ from planning models.
Data-led deployment framework combining national statistics with clearly identified engineering planning benchmarks.
| No. | Integration Dimension | 2024 Reference Data | Recommended Solar-Charging Action | Primary Benefit | Data Basis |
|---|---|---|---|---|---|
| 1 | NEV Fleet Scale | 31.40 million registered new-energy vehicles in China at the end of 2024. | Prioritize solar-linked charging hubs in high-density residential, commercial, logistics, and public-parking areas. | Reduces grid pressure and improves access to locally generated electricity. | Ministry of Public Security, 2024 vehicle statistics. |
| 2 | Charging Infrastructure Capacity | Approximately 12.82 million charging facilities nationwide by the end of 2024, including about 3.58 million public facilities and 9.24 million private facilities. | Add rooftop or canopy solar, energy meters, and controllable chargers when existing sites are expanded or upgraded. | Uses the existing charging network as the foundation for distributed solar integration. | National Energy Administration, 2024 charging-infrastructure data. |
| 3 | Solar Power Expansion | China had approximately 887 GW of installed solar power capacity at the end of 2024. | Coordinate distributed photovoltaic generation with local charging demand, battery storage, and time-of-use tariffs. | Increases direct solar consumption and limits renewable-energy curtailment. | National Energy Administration, 2024 power-industry statistics. |
| 4 | Solar Canopy Design | Typical commercial parking-canopy planning benchmark: 1.0–1.5 kW of photovoltaic capacity per parking space, subject to roof area, shading, and local irradiance. | Use elevated photovoltaic canopies above parking spaces and connect them to on-site charging distribution boards. | Provides shade, weather protection, and on-site renewable generation. | Engineering planning benchmark; final capacity requires a site survey. |
| 5 | Smart-Charging Control | A controllable charging system can schedule charging power in 5–15 minute intervals, depending on the charger and energy-management platform. | Prioritize solar surplus, then low-price or low-load grid periods; reduce charging power during local peaks. | Improves solar self-consumption and lowers peak demand. | Common energy-management-system design range; project specifications may differ. |
| 6 | Stationary Battery Storage | A practical commercial-site planning range is 0.5–2.0 kWh of stationary storage per daily charging session, subject to load profile and grid limits. | Store midday solar generation and discharge during evening charging peaks or periods of limited grid capacity. | Reduces transformer upgrades and increases solar utilization. | Engineering planning range, not a national average. |
| 7 | Vehicle-to-Grid Readiness | V2G remains an emerging application in 2024, with compatibility dependent on vehicle, bidirectional charger, communication protocol, and local grid rules. | Begin with controlled pilots at bus depots, logistics yards, government fleets, and workplaces with predictable parking times. | Creates flexible demand and potential short-duration grid-support capacity. | Application status based on China’s 2024 V2G demonstration and pilot-development stage. |
| 8 | V2G Operating Envelope | Recommended pilot benchmark: reserve 10–20% of connected battery energy for mobility needs and limit grid-support events according to user consent and battery requirements. | Use opt-in schedules, minimum state-of-charge limits, and compensation for exported energy and battery service. | Balances grid services with driving availability and battery protection. | Pilot-design benchmark; actual limits require technical and regulatory approval. |
| 9 | Load and Grid-Connection Management | A charging site should be assessed against transformer capacity, feeder limits, local peak demand, and the applicable time-of-use electricity schedule. | Install dynamic load management, power-quality monitoring, and export controls where grid export is restricted. | Prevents overloads, voltage issues, and unnecessary grid-connection costs. | Site-specific electrical design requirement. |
| 10 | Performance Measurement | Recommended core indicators: solar self-consumption ratio, renewable-energy share, peak-demand reduction, charger utilization, V2G availability, and user charging completion rate. | Connect photovoltaic meters, chargers, storage, vehicles, and grid meters to one energy-management dashboard with interval data. | Makes operational savings, carbon performance, and customer service measurable. | Standard energy-management and charging-project evaluation practice. |
China’s solar-powered EV charging projects need more than attractive canopies. They need operating evidence. The National Energy Administration reported 12.818 million charging facilities nationwide by the end of 2024, including 3.579 million public facilities. Scale is not proof. These figures show infrastructure growth, but they do not guarantee safety or profit. A busy urban site may consume solar electricity at noon. A quiet rural site may export most of it.
Engineers should compare hourly charging demand with local solar output before installation. They should test grounding, insulation, surge protection, emergency shutdowns, and fire access. DC chargers can create sharp load changes. Cable temperatures and connector wear require physical inspections, not only software alerts. Battery storage adds flexibility, but it also introduces thermal and ventilation risks. Grid connections must follow local technical requirements. Check the details.
For ROI, calculate solar yield, self-consumption, electricity savings, demand charges, maintenance, inverter replacement, financing, and battery degradation. Use conservative traffic assumptions. My early estimates were too optimistic because they counted every installed charger as active. That assumption fails. A stronger model tests winter output, cloudy weeks, queue times, and tariff changes. NEA’s 2024 data can validate national market scale, while site meters verify real performance. Leave room for bad months. Real projects need it.
It should follow China’s national DC charging interface requirements. Connector shape, control contacts, locking, and safety timing must match the vehicle inlet. Communication and charging controls also need coordinated standards.
At midday, solar electricity can charge vehicles directly. Surplus power can charge stationary batteries. At night, the grid can support charging. This arrangement may reduce pressure on a local transformer.
Include overcurrent, leakage, surge, insulation, and emergency shutdown protection. Test grounding and fire access. Inspect cable temperature and connector wear physically. Software alerts alone are not enough. Check the details.
Dust, rainwater, hot cables, and uneven parking can affect performance. Test connector heating, communication recovery, and sudden load changes onsite. A clean simulation can miss ordinary problems. Real sites are messier.
It should consider solar output, electricity prices, vehicle battery needs, and transformer capacity. Charging priorities should remain clear. Cloud cover can reduce solar output quickly. Keep backup capacity available.
Bidirectional charging can discharge parked vehicles during evening peaks and recharge them overnight. Start at sites with predictable parking times. Use conservative discharge limits and transparent compensation. Perfect algorithms do not exist.
Measure battery aging, user acceptance, payment accuracy, and actual driving patterns. Install smart meters first. Review results monthly. Planning models often look cleaner than real behavior.
Include solar yield, self-consumption, electricity savings, demand charges, maintenance, financing, inverter replacement, and battery degradation. Use conservative traffic assumptions. Do not count every installed charger as active. That assumption fails.
Compare hourly charging demand with local solar production. Review winter output, cloudy weeks, queue times, tariffs, and transformer limits. National figures show market scale, not site profit. Local meters provide stronger evidence.
By the end of 2024, China had about 31.4 million registered new-energy vehicles and 12.8 million charging facilities. These figures show market scale. They do not prove safety, utilization, or profitability. Site evidence matters more.
This guide explains how to integrate solar power with EV charging in China through a practical, data-driven approach. It begins by assessing local demand, considering that 12.87 million new energy vehicles were sold and 12.82 million charging facilities were available in 2024. System designers can then size photovoltaic generation, battery storage, and charging capacity in relation to China’s 887 GW solar base, balancing daily charging needs, weather conditions, and grid constraints.
The article also highlights the importance of developing grid-connected DC charging hubs that follow the GB/T 20234 standard, while using smart charging to shift electricity consumption toward periods of strong solar output. With China’s NEV fleet reaching 31.4 million vehicles in 2024, vehicle-to-grid functions may further support energy flexibility. Finally, safety testing, operational monitoring, maintenance planning, and return-on-investment analysis should be verified against national charging-infrastructure data to ensure reliable and economically sustainable deployment.

Irvion Charger